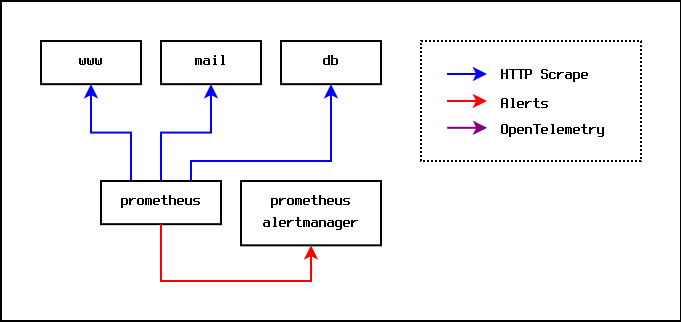
The traditional starting point for monitoring is to install Prometheus and have it scrape metrics from each machine being monitored. Each monitored machine runs a node-exporter service that exposes metrics over HTTP, and the central Prometheus server scrapes metrics from each node-exporter service every ten seconds or so.
The Prometheus server maintains its own persistent internal time series
database, and can produce pretty graphs of metrics on demand.
Additionally, the Prometheus server can be given alerting rules such that
it will generate alert messages when a given rule evaluates to true for
a specified time period. An example of this might be a rule such as
node_memory_available_percent < 10.0. Intuitively, this can be read as
"generate an alert if the amount of available memory on a node dips below
ten percent for a configured period". When an alert rule is triggered, the
Prometheus server sends an alert to an alert manager server. The alert
manager is responsible for routing alert messages to the people and places
that should receive them. For example, alert messages relating to the
node_memory_available_percent signal might be configured to be routed to the
email address of the hardware administration team.
The whole setup looks like this:

This works fine, but at some point you come across an application that uses OpenTelemetry. OpenTelemetry offers far richer monitoring signals; it offers logs, metrics (a superset of Prometheus metrics), and traces.
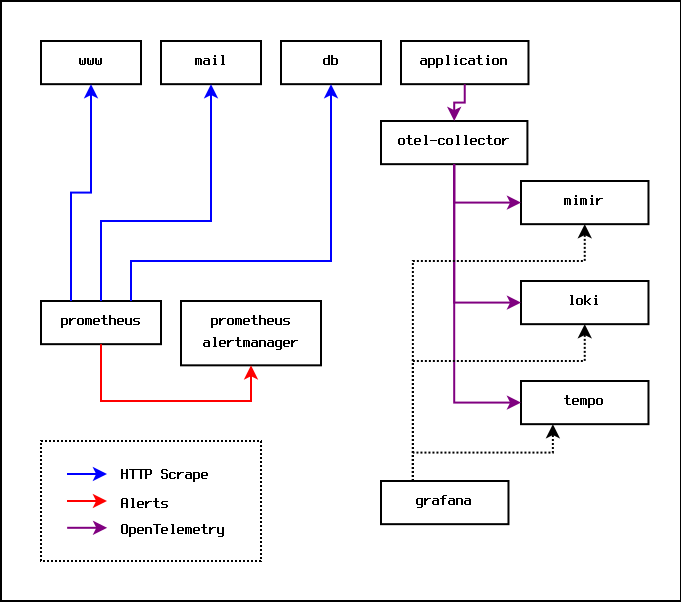
Applications send OpenTelemetry signals to a collector, which then batches and forwards the signals to various servers for storage and analysis. In practice, because they are free, open source, and can be self-hosted, those servers will usually be the various offerings from Grafana Labs.
Specifically, metrics will be sent to Grafana Mimir, logs will be sent to Grafana Loki, and traces will be sent to Grafana Tempo. On top of this, a Grafana server is run to provide a dashboard and to provide alerting.
The monitoring setup then looks like this:

This is a problem, because now the metrics signals and the alerting rules are split between the Prometheus server, and the Grafana server. Some systems are producing Prometheus metrics that go to the Prometheus server, and some systems are producing OpenTelemetry signals that end up in the Grafana server(s).
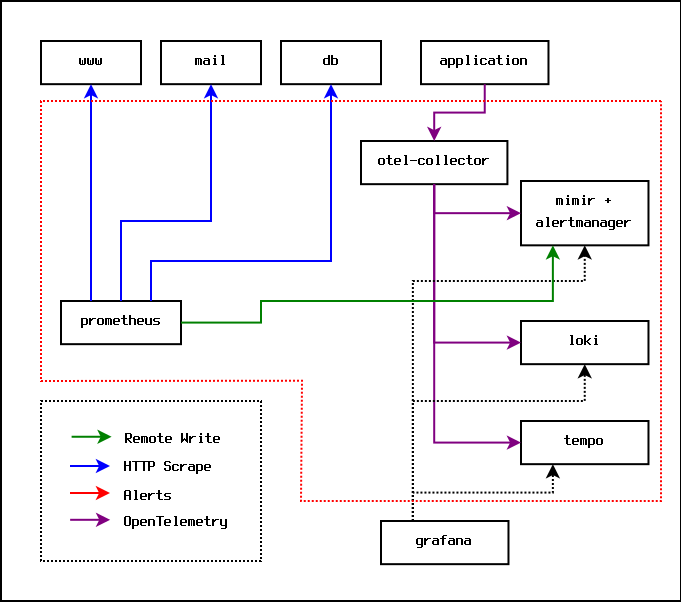
It turns out that Grafana Mimir provides an optional implementation of the Prometheus AlertManager, and Prometheus provides a remote write option that can push metrics directly to Grafana Mimir. This means that you can remove the Prometheus AlertManager entirely, put all the alerting rules into Grafana Mimir, and set up one dashboard in the Grafana server. At this point, the Prometheus server essentially just acts as a dumb server that scrapes metrics and sends them directly to Mimir for storage and analysis.
The monitoring setup ends up looking like this:

In practice, everything inside the dotted red line can run on the same physical machine. At some point, the volume of metrics will result in each of the Grafana components needing to be moved to their own separate hardware.